PapaFix is an on-demand home-repair marketplace for the Philippines, a funded venture under NAM Builders Supply Corp: customers book electricians, plumbers, and aircon technicians from one mobile app, while technicians accept and complete those jobs from another — both now through Google Play closed testing. The two apps write to a single Supabase Postgres database, but the business had no way to actually oversee the operation — which jobs were stalling, which payments hadn't cleared, where technicians were in the field, or whether a record had been quietly altered. As founding developer I built the web platform that sits over all of it: the control room for the entire business.
What I built
I designed and developed a dark-mode admin panel in React and Supabase that reads, oversees, and corrects everything the two mobile apps generate. The customer app, the technician app, and this panel all share one Postgres database — the apps own the operational writes, and the panel is the layer that gives the business visibility and control over them. It is locked to admin accounts only, enforced not just in the UI but by Postgres row-level security, so it holds full oversight without ever shipping a service key to the browser.
Day-to-day operations
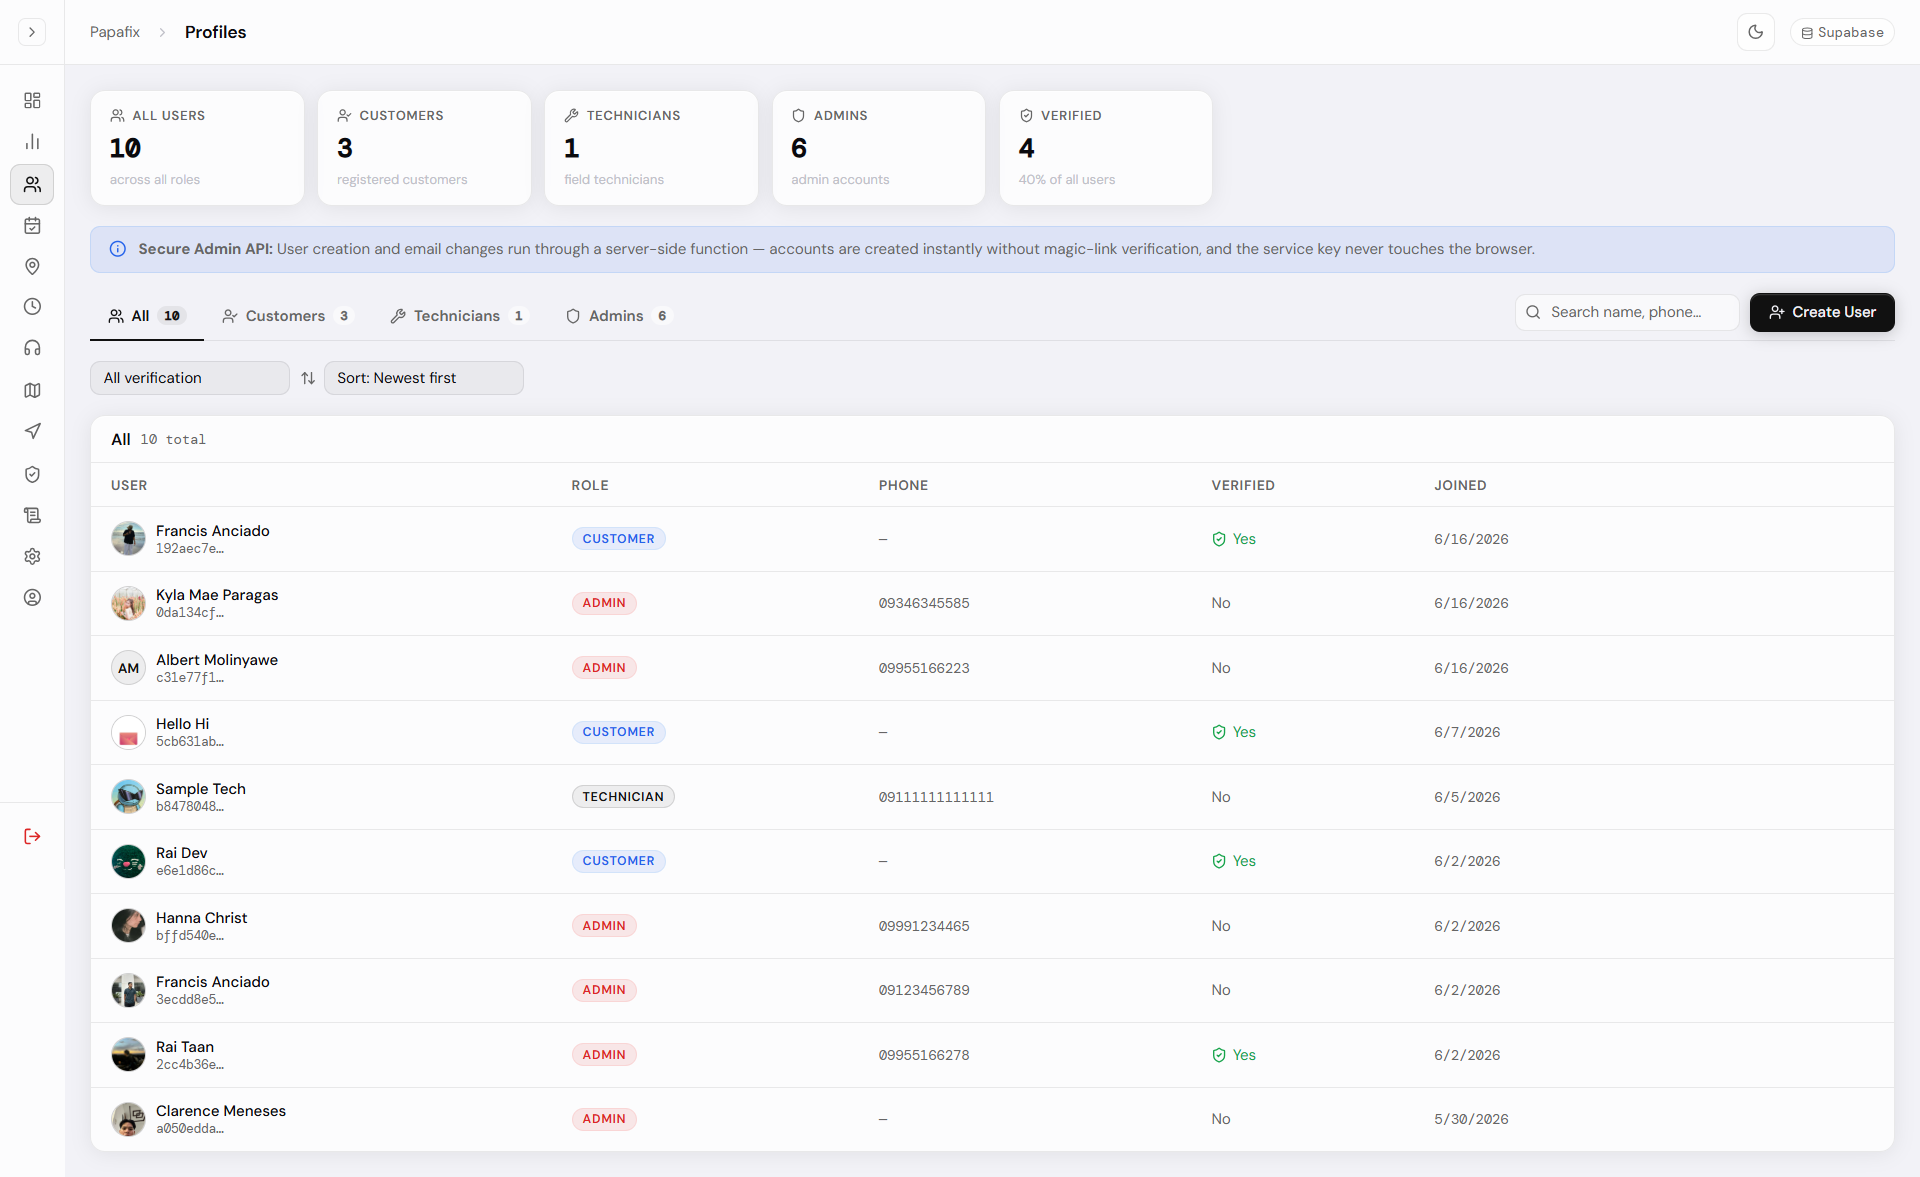
The management tabs cover the operational core. I built full create-read-update-delete for user profiles — searchable and role-filtered across customers, technicians, and admins, with base location, service categories and service radius for technicians — and routed account creation and email changes through a secure server-side Edge Function so the service key never touches the browser. Bookings get the same treatment with status, category, payment, and date filters plus a full detail view down to the inspection checklist and on-site QR token. Alongside these sit saved customer locations with inline map previews, a technician availability scheduler with per-slot toggles, and a support-ticket queue with status and priority.
Seeing the field in real time
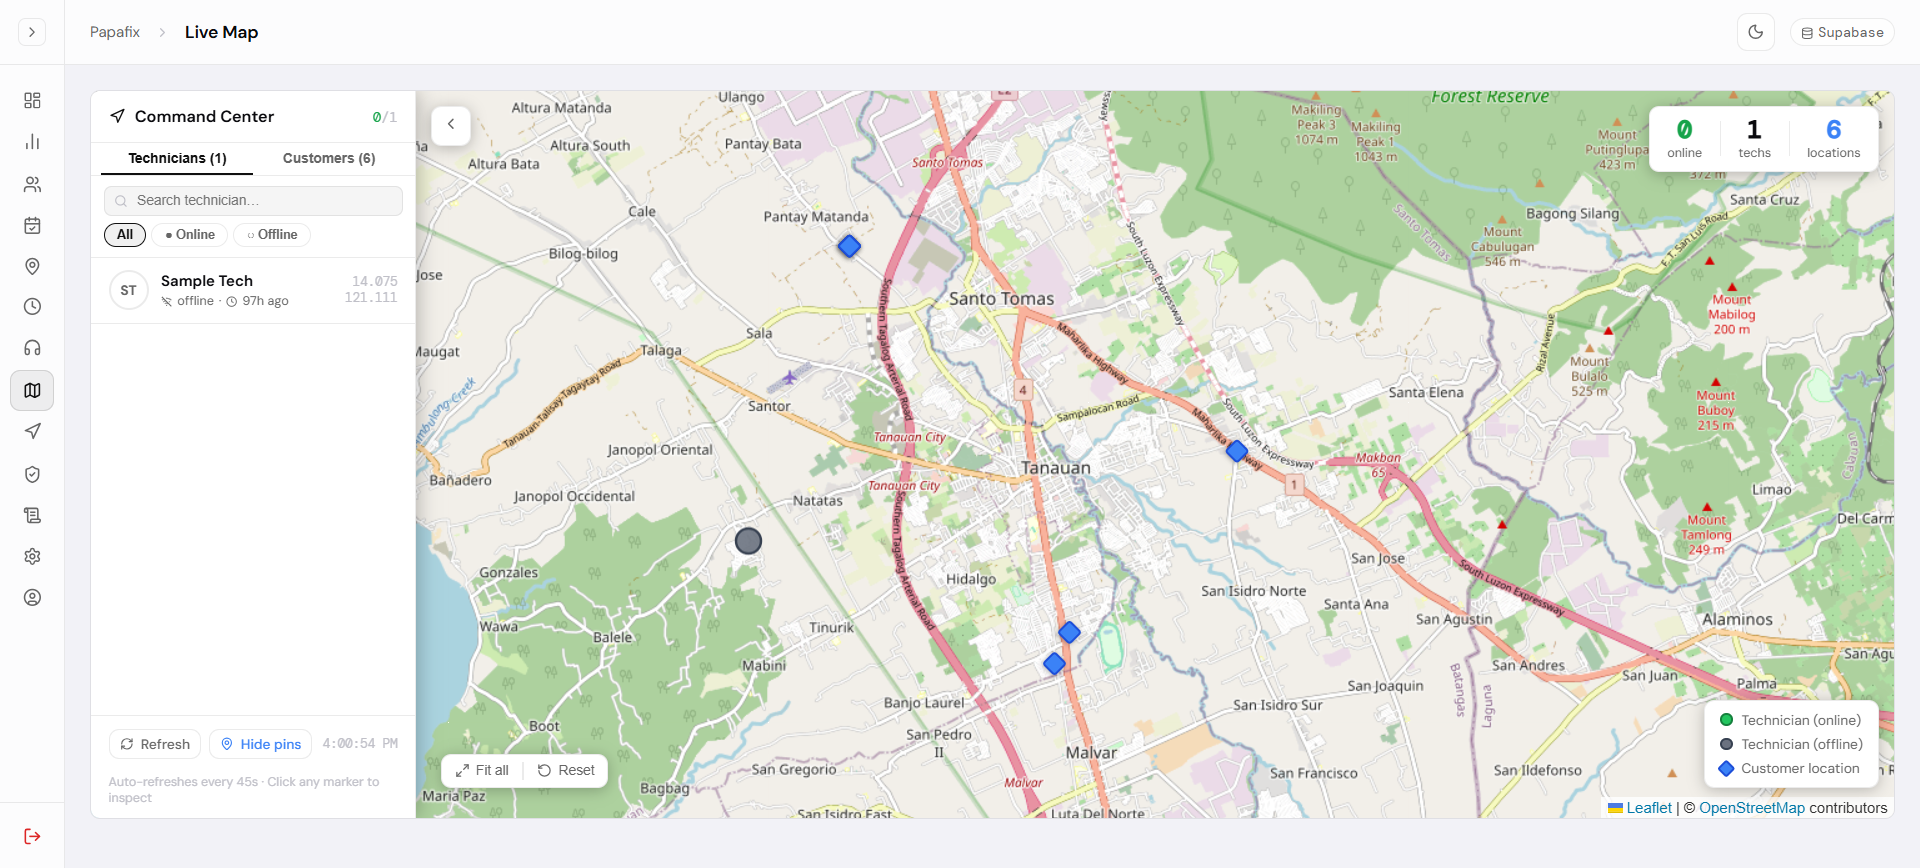
Because technicians work in the field, the panel tracks them in real time. The Live Map renders every technician on an interactive Leaflet map — green when online, grey when offline — alongside the blue pins of active customer job sites, and it auto-refreshes on its own. A companion Tech Locations view lists each technician's last-known coordinates and how long ago they reported in, for when I need the data as a table rather than a map.
Pricing and getting paid
A marketplace is only as trustworthy as its prices, so the panel owns them outright. I built a pricing surface where an admin sets the aircon price grid and per-category base prices, then layers on the add-on admin fee, VAT, and distance-banded travel-fee tiers — the same numbers the customer app quotes upfront, edited in one place instead of hard-coded in an app release. Payment is the other half: a verification queue moves jobs through awaiting, paid, and unpaid, with cash-proof photos reviewed and rejected with a reason, and settlement handled by a dedicated Edge Function rather than a client-side write. A separate tab manages the GCash, Maya, and bank QR codes customers actually pay against.
Analytics and insight
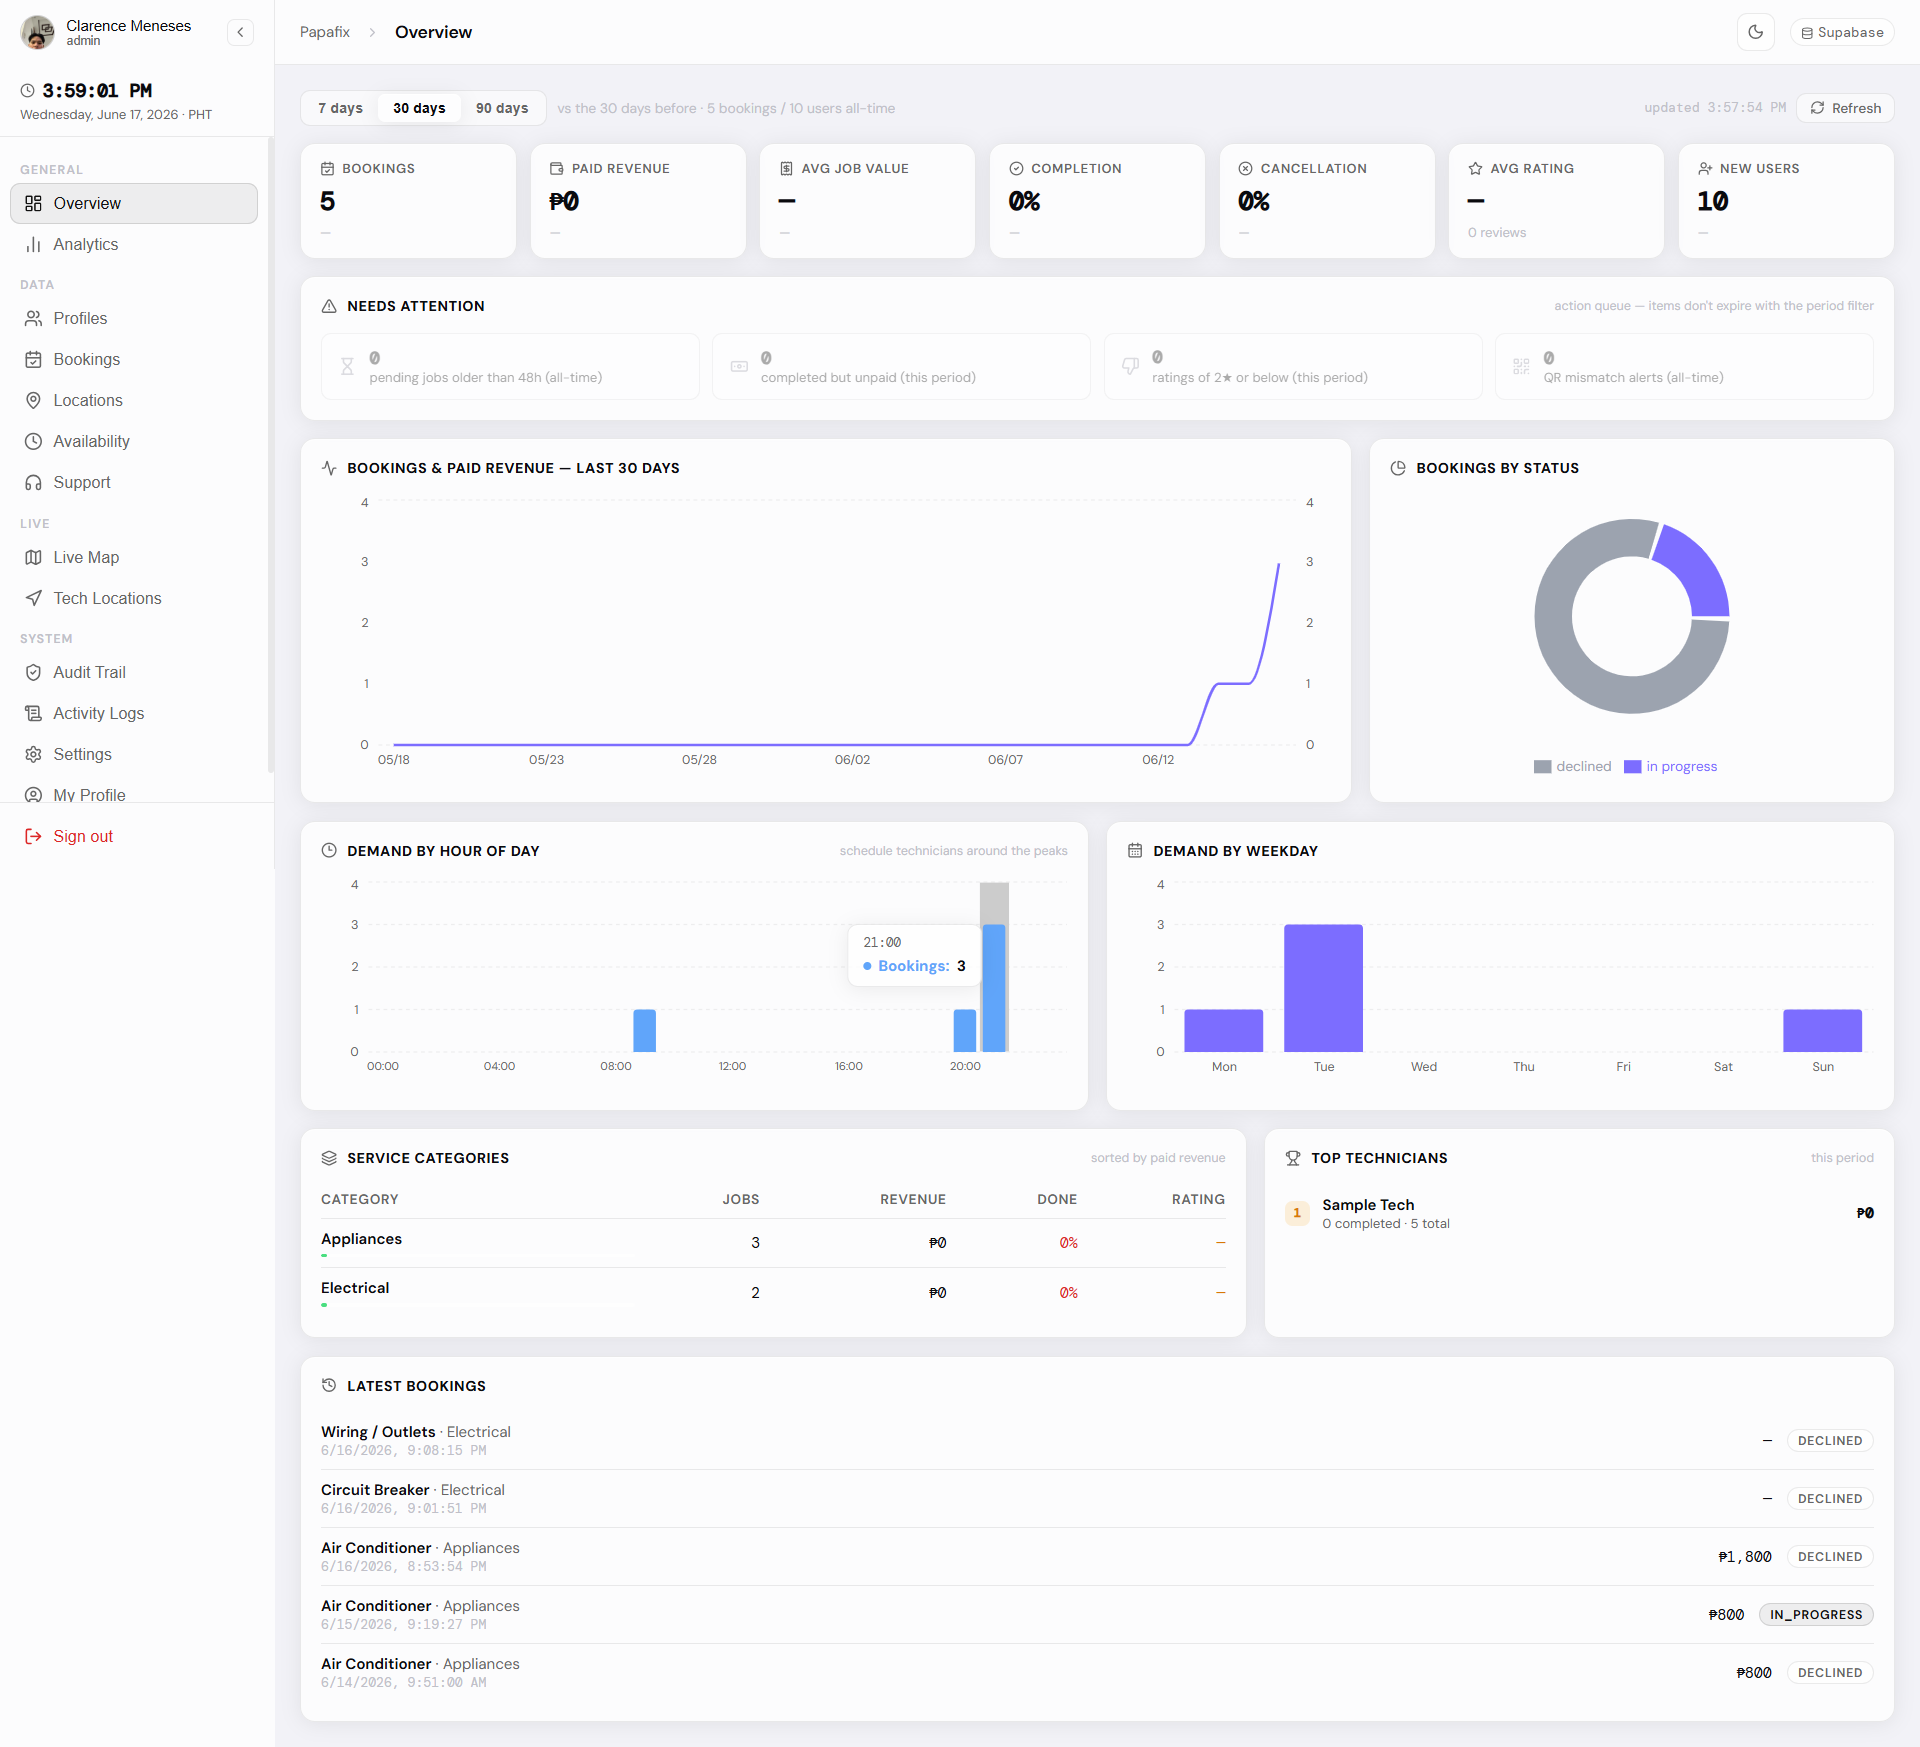
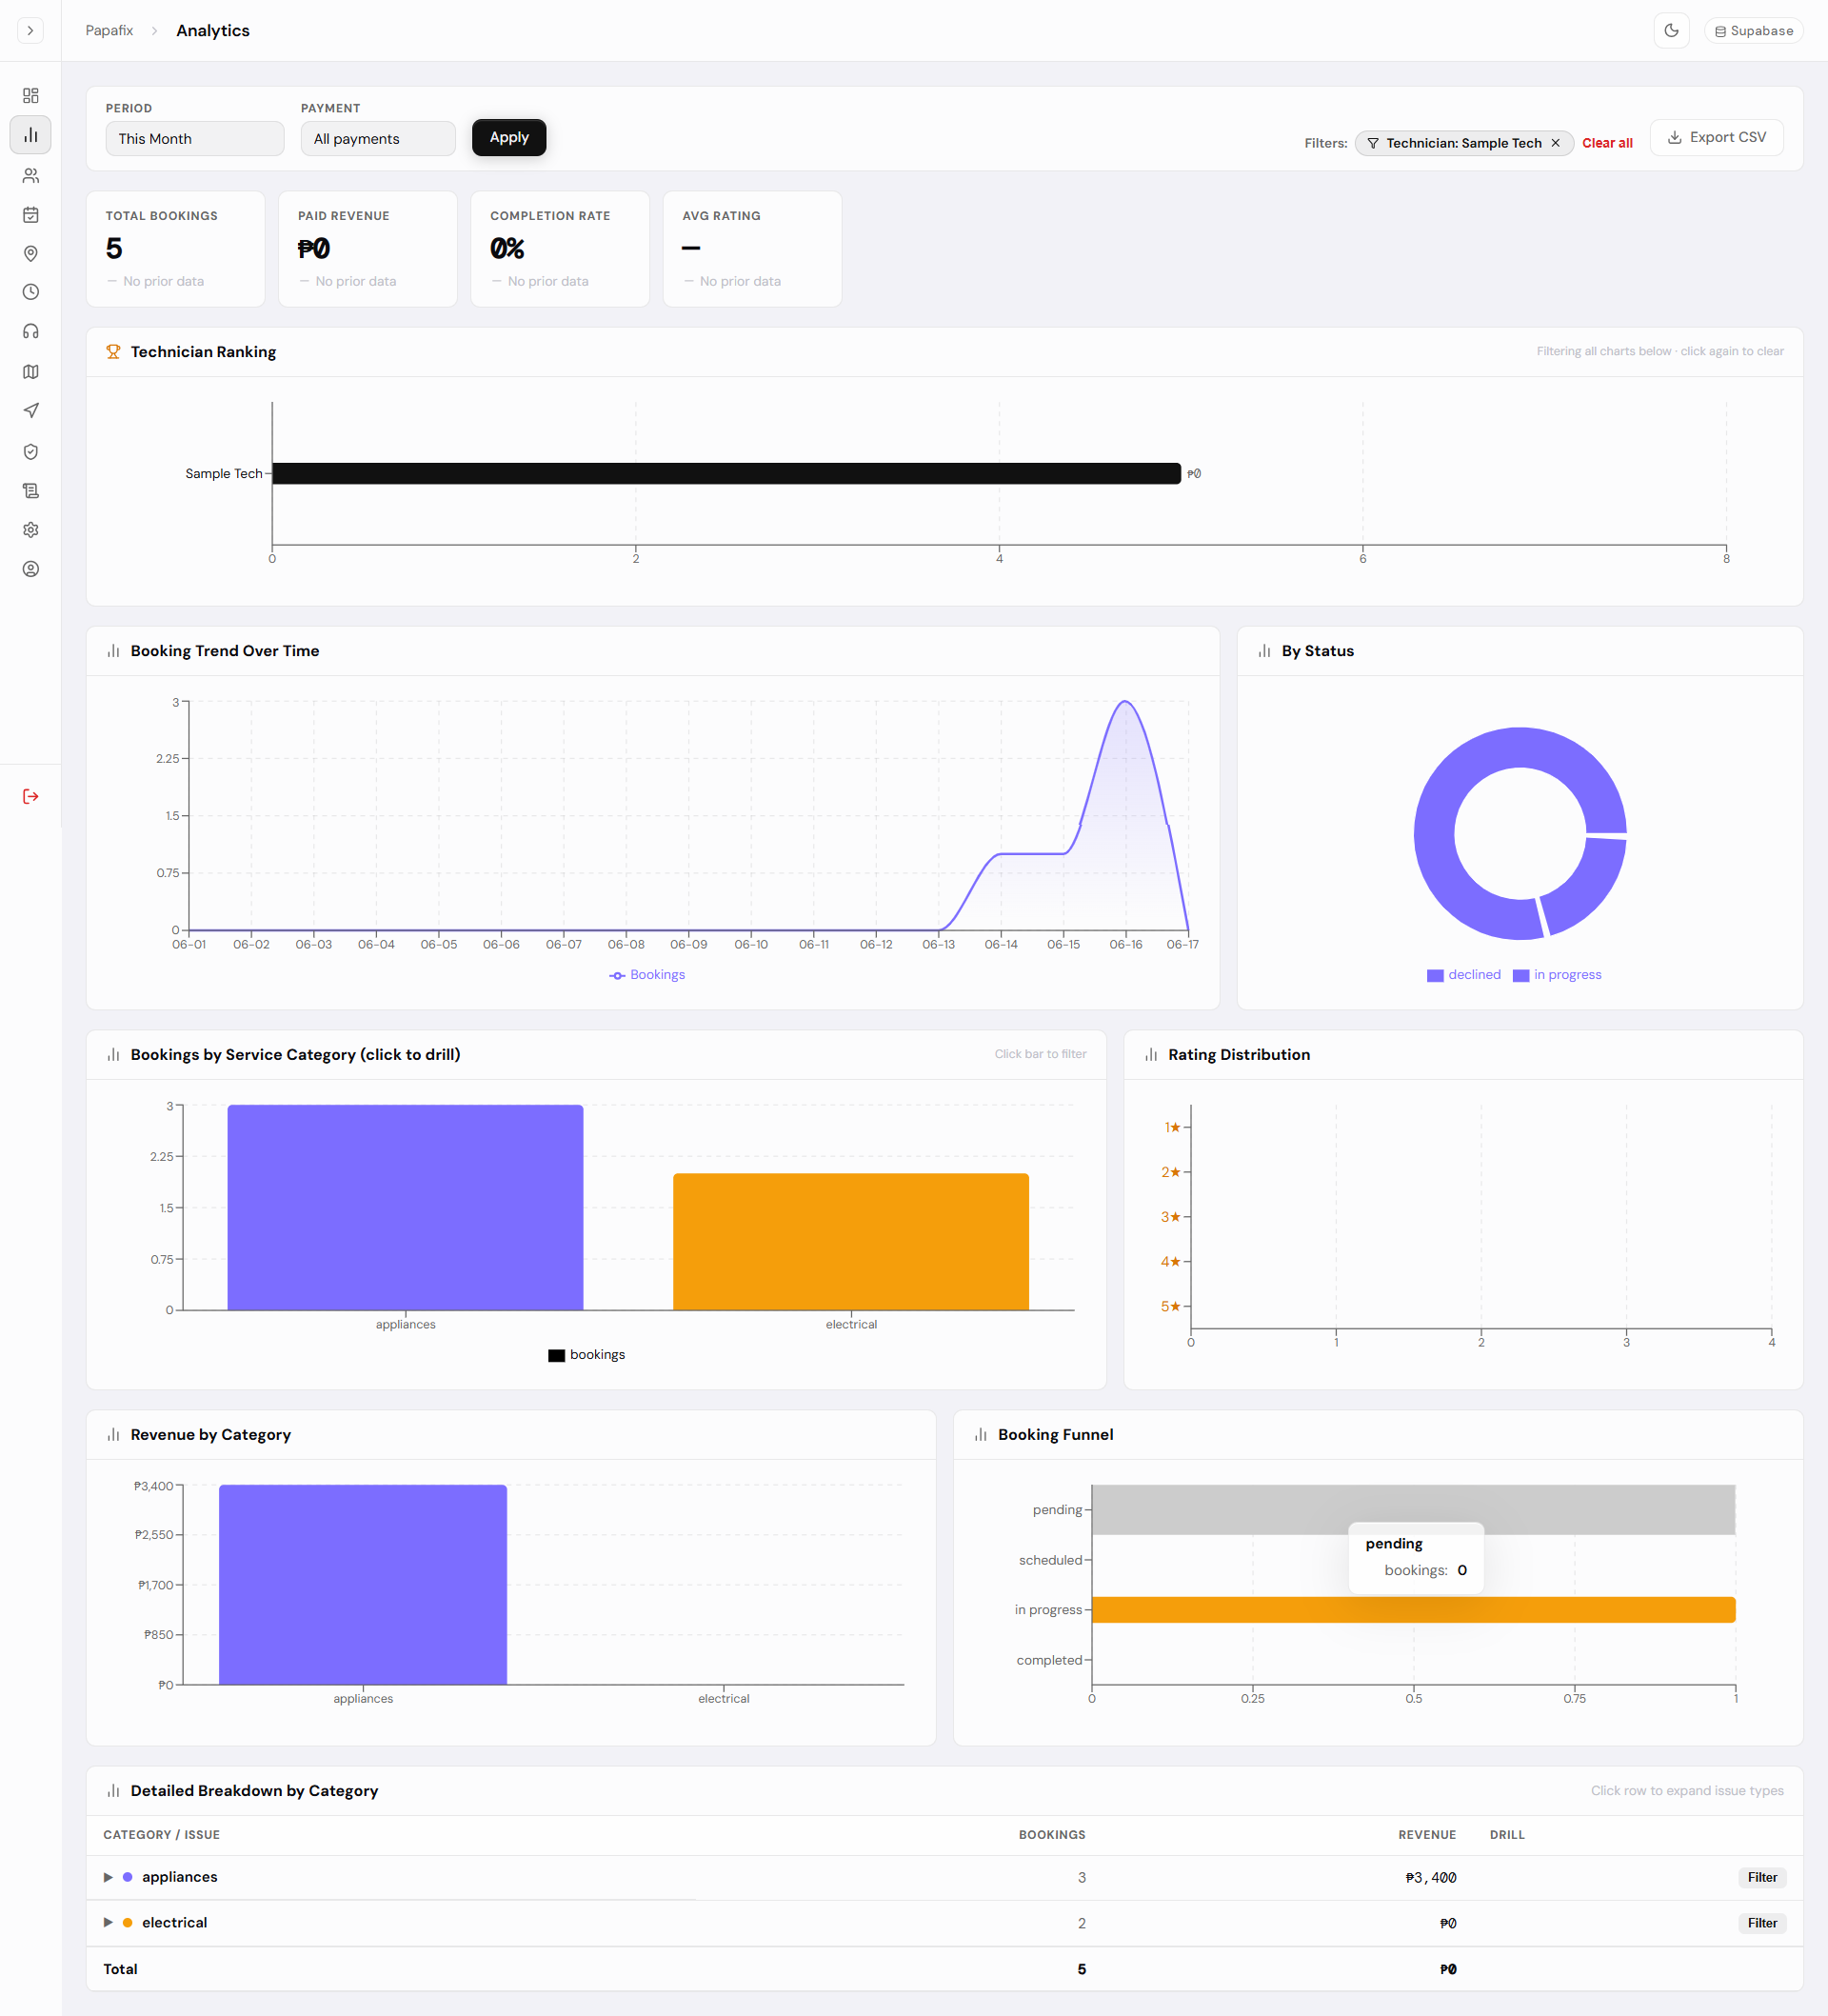
The Overview dashboard is the at-a-glance health check: headline KPIs against the previous period, a bookings-and-revenue trend, demand patterns by hour and weekday, a top-technicians leaderboard, a per-city revenue split with an adjustable manager-share percentage, and a needs-attention queue that surfaces stale jobs, unpaid completed work, and low ratings. The Analytics tab goes deeper, with drill-downs by category, status, and payment, and a technician ranking where clicking one bar cross-filters every chart on the page. Both started out pulling thousands of raw booking rows into the browser to crunch client-side, which doesn't scale — so I moved all of that aggregation into PostgreSQL functions that return pre-summarised JSON, backed by targeted indexes and server-side pagination so the panel stays responsive into the hundreds of thousands of rows.
Oversight and integrity
Oversight only means something if the records can be trusted. The audit trail records every booking and payment event the moment a row changes — created, status moved, technician reassigned, payment captured, fee adjusted — written by Postgres triggers through a SECURITY DEFINER function under row-level security with no update or delete policy, so even an admin can't forge or erase one. I deliberately scoped it to the facts that change a record rather than taps, locations, or message contents: a complete paper trail without surveilling users. A separate activity log captures what admins themselves do inside the panel, keeping the two concerns cleanly apart.
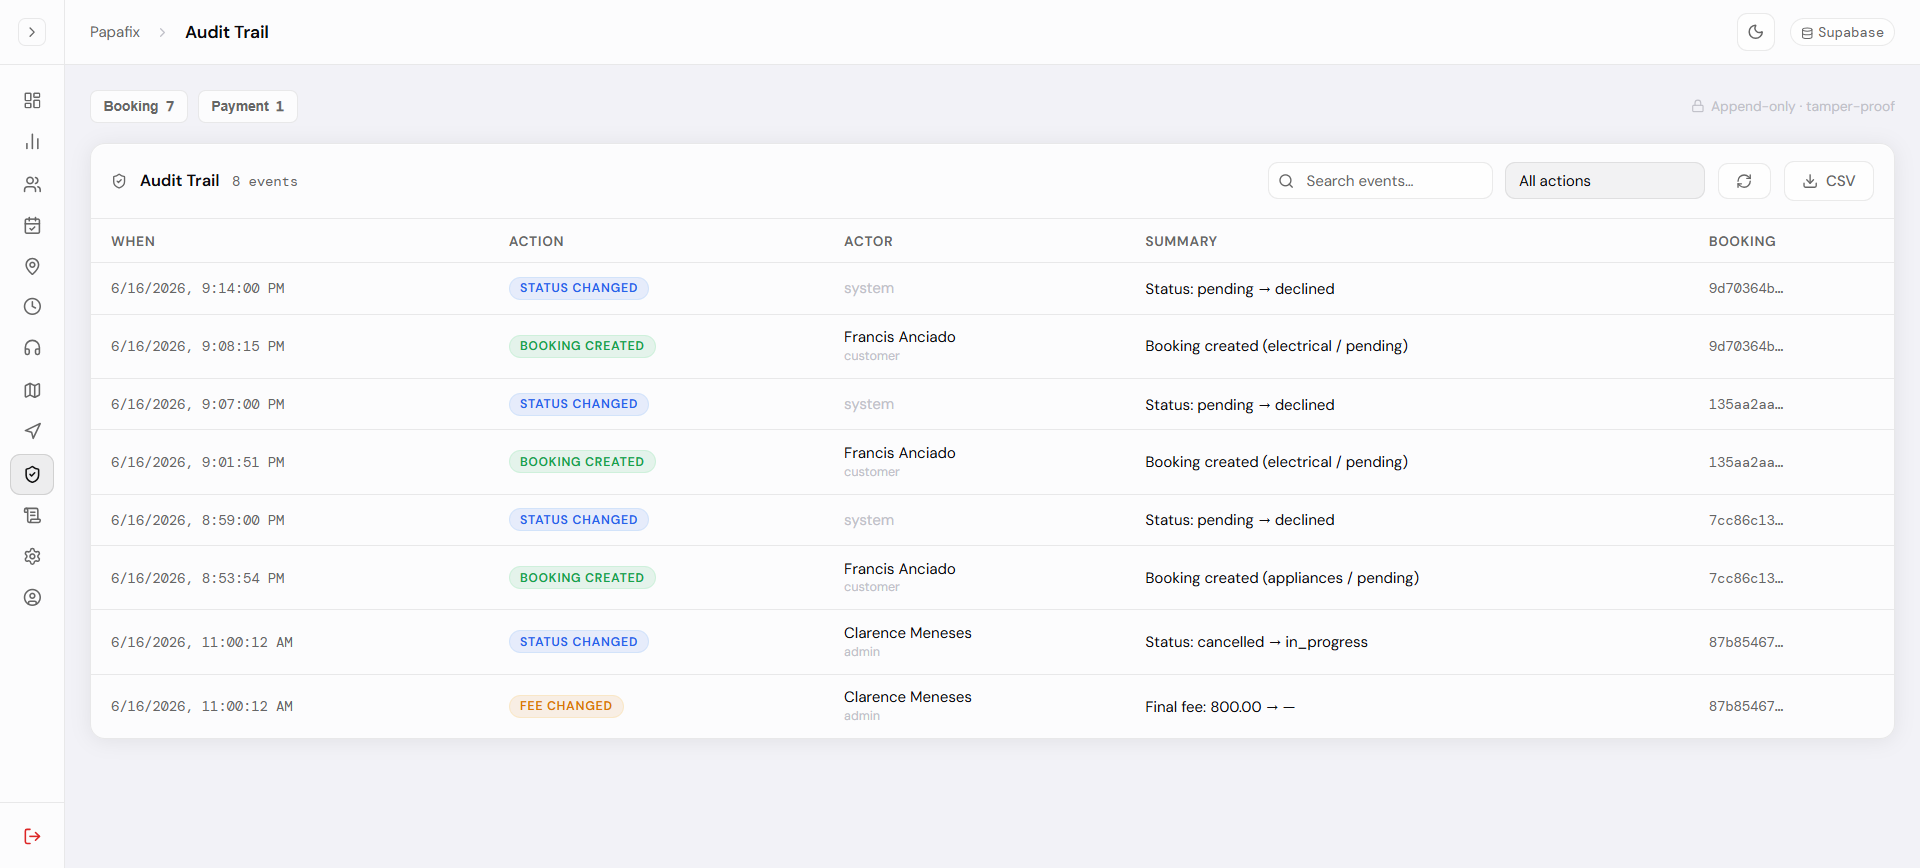
Admin itself is tiered rather than all-or-nothing: a roles-and-access screen, reachable only by a super admin, decides which admins can touch pricing, payments, or accounts. Beside it sits a user-reports queue where misconduct reports filed in either direction — customer against technician, or technician against customer — are triaged, so the same trail that protects the records also protects the people using them.
Conclusion
PapaFix is the project where I owned an entire operational surface end to end — from the React interface down to the Postgres triggers, RPCs, row-level security policies, and the Edge Functions that keep privileged work off the client. The throughline was building for scale and trust: aggregate on the server so it holds up as the data grows, and push integrity into the database where it can't be bypassed. It is the clearest example of how I think about full-stack work — that the hard guarantees belong close to the data, and the browser is just an untrusted client looking in.